
(Click image for full-size)
Above is the daily chart for the SPY, a highly traded ETF of the S&P 500. Shortly after the May 6th “flash crash,” we can see the trading range (cyan rectangle) we’ve been trading in, including an area of resistance (marked “old resistance”), which happens to coincide with the closing price on May 6th.
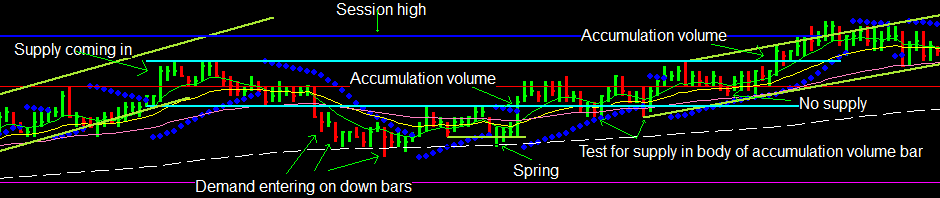
From there, we get a Wyckoff spring (something covered in the Volume Spread Analysis Rules post), which is a break below support in a trading range during an accumulation phase, designed as a shakeout to pull more supply out of the market and to encourage fresh shorts to enter the market.
It is important to note that the first two red bars close off their lows, indicating buying stepping into this weakness, and then the third red bar has high volume and while being a down bar, closes up near its high, indicating some very bullish activity entering the market.
Another bullish sign (marked bullish confirmation) is a very important area, as it is the first reaction low since the rally after the Wyckoff spring, confirming the strength of the market and setting it back on the bullish path by marking its first higher low.
We’ve had a strong rally since, and as it’s been mentioned several times in recent posts, the professional interests have been continuing to accumulate and add to their long positions as the “bad news” has shaken out more of the retail traders.
This past week has been a very interesting level, coinciding with the area marked “old resistance” and the closing price of May 6th before it. Often when the market revisits an area of resistance it will basically “pause” and trade sideways as it works through and absorbs the supply here before turning higher.
Friday marked a very important day, as we tested and confirmed our upward trend line yet again, initially selling off to the unemployment report and Goldman’s announcement that they were lowering GDP expectations (yeah, I bet they have nothing to gain by getting retail traders to hit the panic button and then swooping in to buy off the lows).
In fact, this is exactly what we saw take place. Over in the e-mini S&P, we rallied 16 handles off of our 1104 low to close the market at 1120! This is a very bullish indicator which has helped shake out the supply in this previous area of resistance, and it has shown us that professional interests are still interested in higher prices. With all of the strength in the background, I would look to break out of this range shortly with some more strong movement to the up-side.
